Sunday, December 2, 2012

NDX100 & Small Caps do what they are supposed to; but....

NDX100 Daily Close @ 11/30/2012
Equity Markets took their early week pause; pushing higher into Friday with the NDX100 & Small Caps both outperforming.
Only 'wrinkle' is the consecutive days; Thursday & Friday, with Indecisive Candle Chart patterns for the NDX100. This suggests the potential for a larger 'correction' of the rather fast 8% gains.
There is also a GAP @ 2604.50 that needs attending to: a 'closure'.

Monday, November 26, 2012

S&P500 @ 50% retrace of losses.......

S&P500 Daily Close @ 11/23/2012
So far so good as the S&P500 respects the 1346 level (see Post below) and 'scoots' higher back to the 50% retrace of the retrace @ 1395.
Immediate 'indigestion' may cause a pause; beyond this & the 61.8% level 'beckons' @ 1425 coincident with the declining 50day SMA.
Tactical 'Longs' should take 'em & run @ that level; the more Strategic types only pausing to reflect & see what transpires there.
This Rally may be Santa Claus & the stocking could be 'large'.

Tuesday, November 20, 2012

S&P500 meets the 1346 target (1343 Low), Out-Side UP Day Friday 'says' higher......

S&P500 Daily Chart @ Close: 11/19/2012
The 61.8% retrace (1346) of the gains from the 1266.74 June lows have been met and a Reversal Day scored Friday to suggest (as per THE WEEKLY's Weekend Edition) that UP is now the way of it.
Resistance @ 1395/ 1410/ 1425 now the immediate hurdles as the 'retrace of the retrace' is in train.
Medium- Term indicators remain vulnerable to further weakness, not today's business but rather a cautionary note for the fleet footed types.

Thursday, November 15, 2012

S&P500's 1st Port of Call......1346

S&P500 Daily Close @ 11/14/2012
Indices following the script so far; the 61.8% retrace of the advance from June's 1266.74 Low dead- head @ 1346.
Beyond that lies 1322; the 38.2% retrace of the Rally from the 1074 2011 Low.
Daily price action of primary import in determining when the 'rot' has run its course.

Monday, November 12, 2012

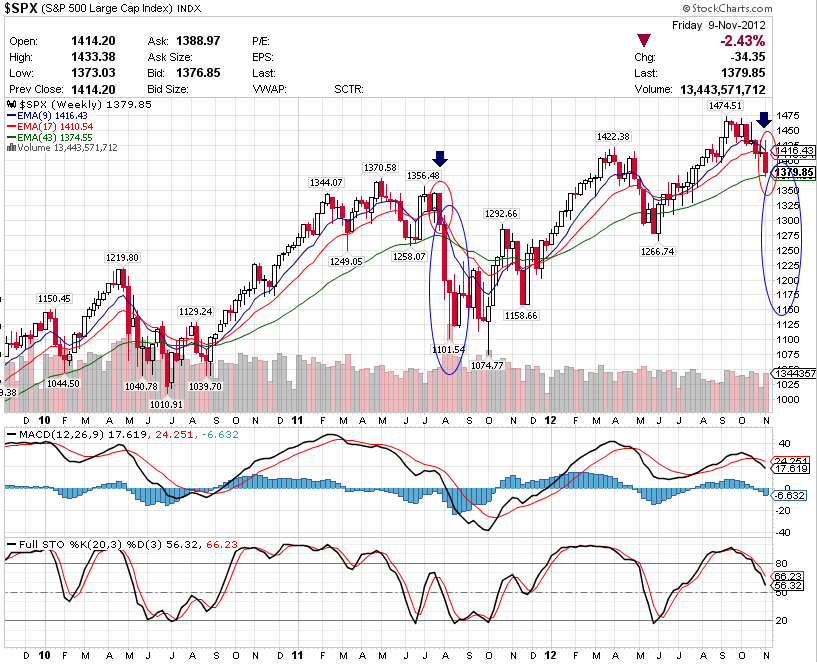
A 2011 'repeat' performance?

S&P500 Weekly Chart @ Close 11/09/2012
Worth noting that a similar 'set-up' occurred in 2011 just before the 200pt 'swoon' (15%) down to the 1100 lows in August.
Only took 2 weeks to boot!
We know what the 'tail risk' is Short- Term...........caveat emptor.