Friday, December 18, 2015

NDX100: An Error; a GAP & then our Audible.......Still Short

NDX100 Daily Chart @ Close 12/17/2015
GAP below from Monday's 'High' Close @ 4571.2 in need of a Fill (not shown on the Daily Chart); the Error in NOT respecting the Long- Tail 4- Hour Candlestick Monday's Open Trade(signaling a S/T Low) & then our 'Audible' on Wednesday's Close > 4640 post the FED Rate Hike BUT.....amid Lower Crude $'s & Industrial Production #'s that left that nagging feeling......NOT necessarily Disciplined 'stuff' BUT @ times the Auto- Pilot can be disengaged.
So far so good with a reversal & losses; Trade Plan now to take back 1/2 Tactical Short should the GAP @ 4571.2 get closed.
Our S/L? Work in Progress.

Wednesday, December 16, 2015

NDX100: 'Mind the GAP' 4267.45 (Continued).......GAP Fill above.

NDX100 Daily Chart @ Close 12/15/2015
All part of the Frustration as 2015 comes to a Close; the GAP left Open @ 4619.98 NOW Filled in Tuesday Trade.
Losses from here required to maintain the Down- Side Momentum; a Daily Close above 4640 & Santa may yet be 'heard' from into early 2016.
Tactical Short from 4686 remains 'in play'; we know where the Stop is now (Basis the Daily Close > 4640)......with THAT Gap below in our sights @ 4267.45.

Monday, December 14, 2015

Mind the Gap in the NDX100 @ 4267.45......Tactically Short still.

NDX100 Daily Chart @ Close Friday 12/11/2015
The Transports may well be leading the 'charge' lower (see previous post on DJT); BUT it's the NDX100 where we are Short & 'seeking' a Closure of that outlying GAP @ 4267.
Our Tactical Short from 4686 (8 days back) still in play.

Wednesday, December 9, 2015

WTI: A Low or simply hesitation/ Indecision @ the Low?

WTI CFD: Daily Chart @ Close 12/08/2015
Whilst the 'Cash' Chart shows an Inside- Day; the CFD Chart (where the Speculators are) shows an Indecisive one.
Which to follow/ respect?
We'll know soon enough but still worthy of a mention as 'Uncharted Waters' lie beyond this spill in all things Commoditized?

Dow Transports the 'Canary'.....looking increasingly 'troubled'?

DJT Daily Chart @ Close 12/08/2015
If it's ALL about the Global Trade SLOWDOWN, and it is; then the Transports are surely sending us a timely signal that Santa could find himself 'grounded' in December as global trade #'s continue (China/ US) to warn us.

Friday, December 4, 2015

NDX100: "Fast & Furious".....followed by 'Frustrating & Fallible'.

NDX Daily Chart @ Close 12/03/2015
Stubbornness or otherwise; staying Short (Monday 11/23: 4686) has been rewarded amid frustrating trading conditions.
The stubbornly HIGH Put/ Call #'s (1.07) amid new highs for this Rally (Counter?) & another Outside- Down Day Wednesday....the Battle Lines are now drawn @ the Up- Trend Line circa the rising 50day SMA (Buy Cross) @ 4515/20.
Breach below that & Weekly Close BELOW the Critical 200day @ 4455/60 Support; Q1 2016 may prove to be 'historic'?

Tuesday, November 24, 2015

NDX100: FAST & Furious Trade action demands a Tactical Posture.

NDX100 Daily Chart @ Close 11/23/2015
The 'easy' Long Tactical Trade was the GAP 'fill' @ 4500 coincident with the 50/200day SMA Buy Signal 11/16.
Matters NOW complicated by an Outside- Down Day 11/23 suggesting a proper test of the 50/200 Buy Sign circa 4450/70?
Early December machinations re: ECB QE/ FED Hike & the ever lengthening Sino- Commodity SHADOWS......care now.

Tuesday, November 17, 2015

Reversal Higher signals another Buying Opportunity behind us?

S&P500 Daily Chart @ Close 11/16/2015 
GAP closure @ 2055.20 (last Week) was 'our' Short- Term Tactical play; an Outside- Up Day now heralding a retrace of losses from the rare 2116 TdM Set- Up.
Outlying GAP below @ 1951 THE worry still & will haunt this Rally........or not?

Thursday, November 12, 2015

BioTechs complicating matters with an OUTSIDE Daily Reversal?

$BTK Daily Chart @ Close 11/11/2015
Whilst we noted in THEWEEKLY that a 'Fill' of the GAP in the S&P500 @ 2055.20 should be viewed as a necessary & healthy development; the OUTSIDE Down Day witnessed in the HIGH Beta Bio- Technology Index does complicate matters somewhat.
Let's see what eventuates if/ when the GAP @ 2055.20 gets filled.

Monday, October 26, 2015

1987 'Ghost' now past (Trick) & 2011 similarities (Treat) in the offing?

S&P500 Weekly Chart 2010- 15.
Just like Halloween; Technical Analysis ain't Science...it's an ART!
The 1987 similarity now appears illusory & 2011 being discussed as the comparison we should not have missed?
Either way; worthy of note & we do own those 1925 Nov. 4 PUTS!
Interestingly for 2011; opportunities were available up to a year after & yet STILL below the High (1370 then/ 2134 now) before the Rally began in earnest.....2016 to be as frustrating as 2015 before the Rally resumes?
As per THEWEEKLY from early 2015: "Is this the long overdue Correction playing out in Time & not Price?"....could well be.

Thursday, October 22, 2015

"Trick or Treat.......Tragedy or Tremor?".......S&P's hauntingly similar 1987 'Door Knock'....

S&P500 Daily Chart @ Close 10/21/2015
............as per the previous Post; the similarity continues in 'haunting' fashion.
Chatter on CBOE Skew Index abnormalities continue apace; losses from here into Friday, next Week should reveal 'all'?
What's the Catalyst?
That; always the Fool's Game.
What we do about the 'signs' the pertinent issue.
2 Week 1925 Puts now in our 'Bag' before Halloween.
"Trick or Treat?"

Friday, October 16, 2015

S&P500: Ghosts of declines past OR simply a false apparition?

S&P500: 1987 Daily Chart
   

Always a 'dangerous' exercise in making historical comparisons; YET it is worth noting on the similarity to today's Market.
The overlaid 2015 #'s are there for the taking; this move into the 2035/45 Kill Zone (see post below) underway.
Close above 2060 & we ignore the observation.
Reversal Signal our guidepost & immediate losses from this 'area' & it's potentially 'HEADS UP' time; no?

Wednesday, October 14, 2015

S&P500 yet to achieve the 2035/45 'Kill Zone'; Clear & Present Danger.....NOW?

S&P500 Daily Chart @ Close 10/13/2015
                      An ideal retrace into the 'equality'  (C= A) @ 2025 & 38% retrace @ 2032 has yet to be scored; 2022 the best of it (so far).
An OUTSIDE- Down Day is NOT in the script & together with sizable Reversals & Losses across a broad spectrum of sub (SML/ RUT/ Trans) & global indices (BOVESPA)....it's HEADS UP time!
It may all be part of a larger 'conspiracy' to frustrate both the dip buying Bulls & 'Put'ted' up Bears.
That said; below 1925 & the 'Crash' sequence could well be underway.

Friday, October 2, 2015

Ghost of Markets past that 'celebrated' Halloween early.......?

S&P500 Daily Chart @ Close 10/01/2015
Not until a Weekly Close above 2030/45 (61.8%: 2032/ 2045 Previous Low) will ANY notions of 'this too shall pass' be worth 'entertaining'.
NOTABLY: There remains a Daily Open GAP @ 2035.73 which may well be THE Short Trade Opportunity should it be coincident with a 'sign'?
The RISKS however remain firmly skewed for further weakness (1830/ 1675) with the US 10yr Note edging ever closer to it's 1.97% 'ledge'.
October may yet be THE 'event' month for 2015.

Thursday, September 17, 2015

NYSE: GAPs above still in need of 'fills' before the Storm recommences?

NYSE Daily Chart @ Close 09/16/2015
With the impatient Bearish types in search of any clue to justify immediate & further losses; the simplest (& most objective) view was to respect the upside GAPs (created on the Down- side Spill) to be in need of requisite 'fills' before the rot sets in again?
Consistently elevated Put/ Call Ratio #'s have been the 'clue' to being biased a retrace of such losses.
The now 'bag full' of Down- Side Insurance being accumulated MUST bias one's view to 1830 holding; should we indeed get there & beyond that 1675 being a Buying Opportunity of potentially Strategic consequence & NOT just Tactical?

Thursday, September 10, 2015

S&P500 Correction Part I likely past; now the hard part........

S&P500 Daily Chart @ Close 09/09/2015 
The Correction; thus far to 1867 & shy the 1830 Support (favored targeted zone).....would appear to be in 'respite' mode...for now.
Previous precedents teach us that the next few weeks (days?) likely to be the 'eye of the storm' before the true intents of this much heralded Technical Correction play out.
Chinese developments have been our  (THEWEEKLY) Focus #1 since 2015 started; matters there instrumental in 'what happens next' globally & for Risk Assets.
(THEWEEKLY subs remain 'seated' with their JPY & for now...relaxed)

Monday, August 24, 2015

USD now caught in the vortex of Deflation as the Higher Dollar was only adding pain to suffering?

USD Index Weekly Chart @ Close 08/21/2015
Dollar weakness now a symptom OR part of the 'solution' to address endemic Commodity Price weakness (in reality a reversion to L/T Mean Averages. ...another story)?
Dollar Bulls were always @ Risk as the HUGE Wide Range Reversal witnessed months back has been ignored....now @ the cost of being caught Short the other G3 (+ Swiss) currencies that will always be an alternative option.
(THEWEEKLY subs have their YEN & shall relax accordingly).

Friday, August 21, 2015

'Showtime' for the 2015 Correction to finally unfold amid the China Syndrome?

S&P500 Daily Chart @ Close 08/20/2015 
As the inevitable Sino 'correction' on the 'silk' road to riches plays out with 'side- shows' unfolding in Brazil/ Russia & South Africa; the S&P500 finally about to be caught in the vortex of Deflation's 'last say' in a World awash NOT ONLY in QE Credit BUT Goods & Services with excess Labor for as far as the statistic can 'see'?
Support 'immediate' @ 2030/40 with 1980 the next stop on this 'voyage' of Price Discovery as the Central Banking 'lighthouses' risk running out of a 'flame' to keep the global trade bulk carrier from running aground?

Wednesday, August 12, 2015

The Apple never falls far from the S&P500?

Apple (AAPL) Daily Chart @ Close 08/11/2015
Apple's 2015 'fate' has assisted the Benchmark Market Capitalization based S&P500 set Record Highs.
Apple now @ risk of entering a Bear Market......a 50/200day SMA Sell Signal the necessary sign that such is underway.
That said; the GAP in late February that was left in the 'wake' of the near vertical rally has now been filled.
Apple's Medium- Term 'intentions' will influence the S&P500's; so all eyes here for the moment.

Friday, July 24, 2015

China's 'eye of the storm' rally for the S&P500 ends?

S&P500 Daily Chart @ Close 07/23/2015
Monday's Indecisive Day suggestive that the post- China 'crisis' Rally has perhaps run its course?
Any further 'cracks' in China's 'band- aids don't fix bullet holes' response so far & equity markets globally remain highly sensitive (attendant Downside Risk) to Sino machinations.
Commodity markets are NOT waiting for such as they continue to exhibit 'it's over' symptoms in their price erosion.
Caveat Emptor.

Friday, July 10, 2015

CHINA concerns to the fore as the inevitable unravels?

SSEC Daily Chart @ Close 07/09/2015
Chinese delusions of 'fixing' matters economic via Equity Market 'fixes' always @ Risk of coming unstuck in spectacular style (think Mastiff dog fads & fetishes a few years back).
Where to now?
200day SMA has coincided with emergency measures to stem the tide of Selling (or 'Collapse'; as there is NO Selling allowed).........Lower remains THE Risk.

Tuesday, June 30, 2015

Once the Neutrals' lost their patience.......THE Correction?

S&P500 Daily Chart @ Close 06/29/2015
Sentiment #'s that were themselves breaking records with the Neutral Camp 'membership' finally succumbed to impatience with a timely shift to the Bulls last week.
Support @ 2034 beckons in defining the extent of the potential damage as YTD #'s move back into Negative Territory with multiple 'crises' closing in on Risk Assets.
Below 2034 & 2014 (38.2% retrace of gains since 1820) beckons before 1940 (61.8%) which keeps the whole 'shebang' alive Medium- Term.

Sunday, June 14, 2015

US Dollar Bulls not being rewarded for the FED's imminent interest rate move; why?

US Dollar Index Weekly @ Close 06/12/2015
US Dollar Rally not going to 'Plan'?
Would appear so as the Bulls patiently await the FED's intent on raising FED Funds off the Zero Boundary.
Perhaps the Metals are telling us something many do not want to hear?
Risks appear skewed for further Dollar losses; are we ready?

Tuesday, May 19, 2015

S&P500 @ New Record Highs; the NYSE (et al) NOT joining in the 'Celebration'?

NYSE Daily Chart @ Close 05/18/2015
Record Highs for the Big Cap Indices; NOT SO for the broader ones: NYSE/ Small Caps & Russell 2000.
Non- confirmation or simply slow to follow the lead as Sentiment remains firmly in the Skeptic's Camp with a Neutral reading above 45% for a few weeks now?

Monday, May 11, 2015

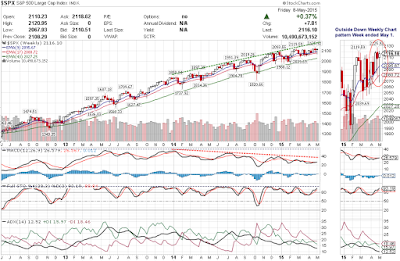
Another false Signal or the Real Deal?

S&P500 Weekly Chart @ Close Friday 05/08/2015
Key Reversal after Weeks of false 'sirens' wailing cautionary technical tales of potential corrective despair.
Are we finally there; wherever 'there' is?
Friday May 8 Close back so close to the Record & Key Reversal Highs suggests a negation of the Signal; weird times may herald a weird reaction up here.

Tuesday, April 28, 2015

NYSE Island Reversal 'escaped'; YET we remain 'ship- wrecked' & same levels......an omen?

S&P500 Daily Chart @ Close 04/27/2015
Key Daily Reversal the 1st Sign that something (anything?) is amiss with this aged Rally?
All the following scored same Daily Chart Reversals @ New Highs:
NYSE/ OEX100/ NDX100/ S&P600 (Small Caps); with the R2000 below it's Highs but also scoring an Outside Down Day.
Should we care? Perhaps so!
Daily Close below 2075 would go a long way in confirming that 'something' has Corrective potential.

Sunday, April 19, 2015

NYSE: We may well 'be there' now...............

NYSE Daily Chart @ Close 04/17/2015
A rare 2 Day Island Reversal?
Nothing overt to say 'it is over'; but many another Index (XLY) suggesting that the long overdue Correction has the opportunity to finally play out.
10,900 breach the 1st Sign of Trouble for the NYSE.

Thursday, March 26, 2015

NYSE: Are we there yet?

NYSE: Daily Close @ 03/25/2015
Frustration for all as another run back to the Highs is rebutted & yet again the NYSE returns to levels form mid- 2014.
Persistent Negative Divergences have 'dogged' US Equity Indices on the Rally (if that's what we can call it?) since early 2104 with resultant give- backs after marginal gains.
The 'Return to Normalcy' won't be no 'Return to Eden' for markets.

Thursday, March 5, 2015

NYSE Bullish Triangle 'resolution' a puff of powder........10,400 next?

NYSE Intra- Day Daily Chart 03/05/2015
What that it?
Sell Signal on the MACD post the Indecision @ the New Record Highs & the NYSE could well 'beat' a hasty retreat back to as low as 10,400.
So; where was the Rally here since mid 2014?

Wednesday, February 4, 2015

NYSE Outside- Up Day does suggest a Bullish resolution for the Triangle......

NYSE Daily Chart @ Close Feb 3rd 2015
Monday's Reversal/ Outside Up Chart has seen strong follow through higher Tuesday to the top-edge of the potentially Bullish Triangle that should 'see' New Highs imminently.
Beyond THAT development & it may have ALL simply been a 'cruel trick' as 2015 unfolds.

Friday, January 30, 2015

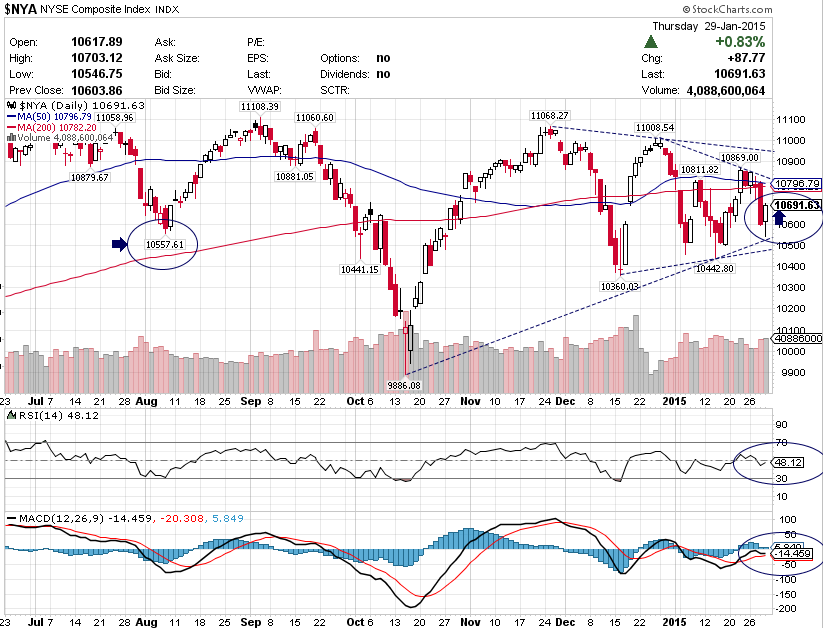
NYSE: Pick a Triangle; any Triangle......Bullish or Bearish?

NYSE Daily Chart @ Close 01/29/2015
Little to report as the Triangle mystery unfolds; our suspicion that is it a Bullish one & New Highs abound.
Whether they are nothing more than a 'fleeting' phenomena or not the larger question to be answered as Q1 2015 edges into the Deflation Fog.
Medium- Term; put us in the Skeptics/ Bears Camp as we sit out this part of the huge Rally since  2009/ 10/ 11....whichever one is your particular 'poison'.

Wednesday, January 7, 2015

Mad Hatters Christmas Rally hijacked by the Realist Grinch?

Dow Transports Daily Chart @ Close 01/06/2015
For those that have been reading; our Bearish Crude View since $100 (THE WEEKLY July 2014) has played out beyond even our wide- eyed expectations.
The ramification for Risk Assets has so far only been marginal; are the Transports portending something more meaningful & sinister?
Perhaps so.