Thursday, December 27, 2012

China & Japan UP nearly 3%.....but who cares?

NDX Daily Close @ 12/26/2012
Outstanding gains in the major Asian indices & Wall Street simply 'ignores' the price action?
What gives?
The 'Grinch' may well have stolen the Year-End festivities with a stumbling end to a 'stumbling' year?

Monday, December 24, 2012

GE Weekly says early 2013 may be 'risky'....

GE Weekly Close @ 12/21/2012
General Electric (GE); like Apple (AAPL) is important.
Where it 'goes'; can the broader market ever be far behind?
Last week's Outside Down Weekly pattern sets up the potential for another leg down off of the late September highs.

Thursday, December 20, 2012

Chart of the Day: GE (General Electric)

GE: Daily Chart @ Close 12/19/2012
Similar to Apple (AAPL); GE never strays far from the overall (S&P500) Index, so will the Index follow GE lower?
What's good for GE is certainly 'good' for the broader market.
Into Year-End; market machinations may prove to be a rather 'choppy' affair?

Tuesday, December 18, 2012

Apple says 'not so fast' for the Bears......

Apple (AAPL) Daily Close as @ 12/17/12
Just as the 'bearish' juices got flowing late last week; Apple puts in an 'Outside UP' day come Monday.
This should (emphasis: should) set the foundation for a significant attempt to retrace & potentially put to the 'test' the Negatively Crossed 50/200day SMAs on both Apple & the NDX100 as well.

Friday, December 14, 2012

NDX100: 50 x 200 Day SMAs Cross Negatively....

NDX100 Daily Close @ 12/13/12
Indecisive Chart patterns witnessed Wednesday (12/12/12) heralded the immediate  Short- Term corrective price action lower (See NYSE post below).
The NDX100 has closed below the Negatively Crossing 50/200day SMA's; a noteworthy & bearish signal.
A Weekly Close below (2670) would go a long way to signalling a more substantial correction could well be in order.

Thursday, December 13, 2012

NYSE: FED launches another QE 'round'.

NYSE Daily Close @ 12/12/12
'Buy the rumor, Sell the fact?'.....FED weighs in with another round of QE; to what effect as @ the marginally 'diminishing returns' are more than evident in the economic stats?
At the very least a 'pause' to reflect should be in order with move back to 8200; a simple 38% retrace of the gains since mid- November.

Wednesday, December 12, 2012

S&P500: 1424 gets 'bettered'; so what gives?

Philly Banking Index ($BKX): Daily Close @ 12/11/12
The S&P500 'negates' the immediate 'Bearish' prognosis, yet the banks that should benefit from the rumored FOMC/ FED announcement that another $45B/ month in QE is 'due' tomorrow.....fail to join the > 1424 'party' (note the indecisive pattern 2 days running).
That makes for a cautious stance as the year-ends......Santa notwithstanding.

Sunday, December 9, 2012

NDX100 'Risks' appear obvious..........

NDX100 Daily Close @ 12/07/2012
It would appear that the 'balance of risk' is skewed to the downside.
Apple's chart looks like a Bear Trend; the S&P500 needing to stay below 1424 to add weight to the 'Bearish' prognosis.
USD Index 'strength' and a potential turn lower for the EURUSD are coinciding with this 'set-up'.
Something's 'up' & that does NOT appear to be an appetite for Risk.

Friday, December 7, 2012

Where the 'Apple' falls...can the NDX100 be far behind?

Apple (APPL): Daily Chart Close @ 12/06/2012
The impending Negative Cross on the 50/200day SMAs is now hanging over not only Apple; but the NDX100 (APPL: 15% Index).
Whilst Friday's Non-Farm Payrolls are the major catalyst for markets in general; Apple demands scrutiny as its influence is substantial both in weighted terms on indices (NDX & S&P500), but also in 'sentiment'.

Tuesday, December 4, 2012

NYSE/ S&P500/ Small Caps all 'reverse'.........

NYSE Daily Close as at 12/03/2012
Note the Outside Down day Monday; the 'higher high/ lower low' (AKA: Bearish Engulfing Candle) from Friday's trading with a negative close.
Bearish.....period.
The S&P500 + $SML (Small Caps) both confirm, only the NDX100 not joining the 'party'......yet.

Sunday, December 2, 2012

NDX100 & Small Caps do what they are supposed to; but....

NDX100 Daily Close @ 11/30/2012
Equity Markets took their early week pause; pushing higher into Friday with the NDX100 & Small Caps both outperforming.
Only 'wrinkle' is the consecutive days; Thursday & Friday, with Indecisive Candle Chart patterns for the NDX100. This suggests the potential for a larger 'correction' of the rather fast 8% gains.
There is also a GAP @ 2604.50 that needs attending to: a 'closure'.

Monday, November 26, 2012

S&P500 @ 50% retrace of losses.......

S&P500 Daily Close @ 11/23/2012
So far so good as the S&P500 respects the 1346 level (see Post below) and 'scoots' higher back to the 50% retrace of the retrace @ 1395.
Immediate 'indigestion' may cause a pause; beyond this & the 61.8% level 'beckons' @ 1425 coincident with the declining 50day SMA.
Tactical 'Longs' should take 'em & run @ that level; the more Strategic types only pausing to reflect & see what transpires there.
This Rally may be Santa Claus & the stocking could be 'large'.

Tuesday, November 20, 2012

S&P500 meets the 1346 target (1343 Low), Out-Side UP Day Friday 'says' higher......

S&P500 Daily Chart @ Close: 11/19/2012
The 61.8% retrace (1346) of the gains from the 1266.74 June lows have been met and a Reversal Day scored Friday to suggest (as per THE WEEKLY's Weekend Edition) that UP is now the way of it.
Resistance @ 1395/ 1410/ 1425 now the immediate hurdles as the 'retrace of the retrace' is in train.
Medium- Term indicators remain vulnerable to further weakness, not today's business but rather a cautionary note for the fleet footed types.

Thursday, November 15, 2012

S&P500's 1st Port of Call......1346

S&P500 Daily Close @ 11/14/2012
Indices following the script so far; the 61.8% retrace of the advance from June's 1266.74 Low dead- head @ 1346.
Beyond that lies 1322; the 38.2% retrace of the Rally from the 1074 2011 Low.
Daily price action of primary import in determining when the 'rot' has run its course.

Monday, November 12, 2012

A 2011 'repeat' performance?

S&P500 Weekly Chart @ Close 11/09/2012
Worth noting that a similar 'set-up' occurred in 2011 just before the 200pt 'swoon' (15%) down to the 1100 lows in August.
Only took 2 weeks to boot!
We know what the 'tail risk' is Short- Term...........caveat emptor.

Monday, November 5, 2012

NDX100: Friday's Chart says lower still...to 2608

NDX100 Daily Close 11/02/2012
Friday's OUTSIDE DOWN DAY lends itself to a test of the 62% of the June/ September rally @ 2608.
Daily Price action shall be critical @ that level (or ahead of it) in determining if another run @ the highs is still in effect.........or not.

Friday, October 26, 2012

S&P500 'posts' an Outside UP Day.....'good enough'?

S&P500 Daily Close @ 10/25/2012
Tom DeMark says there is '1' more high to had by the S&P500 before we suffer a serious correction (12%).
If THAT is so; then this sell-off should retrace 38% of the gains from the Secondary Lows @ 1309......right here @ 1411+/-.
Yesterday's 'Reversal' goes a long to suggesting as much, though not confirmed though by other 'brethren' indices in the $NYSE & $NDX100.
Overnight Futures 'action' is suggesting this prognosis is too 'early' & likely 'wrong'......but that can all change before the bell rings on the floor of the NYSE.

Thursday, October 25, 2012

COPPER 'pauses' to reflect, TRANSPORTS seek no such 'solace'.....

COPPER Daily Chart @ Close 10/24/2012
DOW JONES TRANSPORTS @ Close 10/24/2012
Copper has breached the 'critical' Supports circa $3.56, but not on a closing basis.
The Transports have again sold off coincident with a further bout of selling in WTI ($85.65).
Which one shall prove to be the most pertinent, will probably be evident by week's end.
Support in the S&P500 @ 1395 (1407) has yet to be challenged, so perhaps a bit further 'south' before we witness some worthy sign of a low?

Tuesday, October 23, 2012

S&P500 'follow through' Friday (lower)...now a 'pause'?

S&P500 Daily Close @ 10/22/2012
Friday's sell-off confirmed Thursday's 'Outside Down' Day chart pattern.
Contrasting Monday's 'unchanged' close; regrettably on relatively Low Volume as against Friday's High Volume selling. Tuesday becomes interesting to say the least.
Crude continues to trade 'heavy'; all eyes on the final debate & foreign policy.

Friday, October 19, 2012

S&P500 puts in the "outside down day".....

S&P500 Daily Close @ 10/18/2012
Apple & the NDX100 may have given us the sign that we were looking for (THE WEEKLY 10/12/2012); now the S&P500 confirms it with a 'bearish engulfing' day.
Now or never for the correction to kick into high- gear and find out where the supports are?
Nasdaq McClellan Oscillator < Zero & the Summation Index 'closing' in fast @ the Zero Line (heading 'due South'); INTC, MSFT, IBM & GOOGLE now leading with Apple.

'By the #'s': the NDX100 is next on the checklist -

NDX100 Daily Close @ 10/17/2012
Back to the 50day SMA; matching Apple's 'need' to tidy up before the "true intents" of this correction are fully revealed.
Follow through lower now key.

"One birdie" @ a time...............

AAPL Daily Close @ 10/17/2012
The GAP @ $650 has been filled nicely, follow through lower now the sign that matters may get interesting for the 'tactical' shorts among us.

Sunday, October 14, 2012

AAPL lower....now higher into $650?

Apple (AAPL): Daily Chart Close @ 10/12/2012
Apple (AAPL) has led the market lower, Friday's Chart Pattern (holding Wednesday's low) does lend itself to a 'Gap' fill back @ $650 before the true intents are known for the 'i' stock & the market in general.

Sunday, October 7, 2012

AAPL: Apple leads the way..............lower?

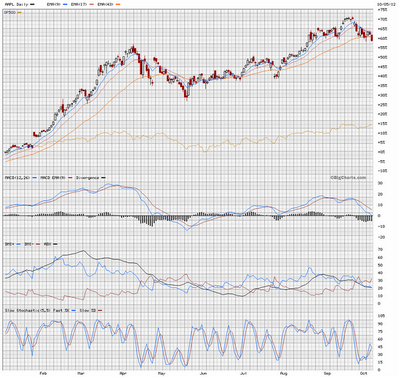
Apple/ S&P500: Daily Chart @ Close 10/05/2012
Apple was the 'lead pony' when the earlier 2012 'sell-off' came into play. A repeat performance for markets into year end?
Note the similarity in the technical studies, especially the MACD threatening a move through Zero?

Thursday, October 4, 2012

ASX200: "now or never"?

ASX200 Weekly Chart @ as Close 10/03/12
Just as the debate over the 'debt laden' Aussie 'miracle' finally gets some air-time (http://www.abc.net.au/7.30/)
perhaps a deep breath or so is needed before the unthinkable happens and THIS rally overcomes 4450...putting all the doomsayers to shame!

Thursday, September 27, 2012

German IFO data is where it's @:

German IFO Survey September 2012
A cursory glance together with the Dow Jones Transports (see previous post) recent 'behavior' is certainly worthy of note as the Transport Index WAS the 'canary' back in 2008.......just like the IFO???

Of note is also the 'so-so' reception of the iPhone5 release as has Steve Jobs' influence finally waned with the product line : John Battelle thinks so...are there any shorts left ?(http://battellemedia.com/archives/2012/09/am-i-an-outlier-or-are-apple-products-no-longer-easy-to-use.php)/ (http://www.bloomberg.com/video/apple-products-no-longer-easy-to-use-battelle-says-vBInxb_tQAujI9B6mB_YXg.html)

Tuesday, September 25, 2012

Transports not part of the 'party'...so far.

Dow Jones Transports Weekly Chart @ Close 09/24/2012
In a week where the Oil price fell sharply; the Transports found no 'solace'. itself suffering a near 6% decline.
What that says about the state of global economic is perhaps 'the canary in the coalmine'?

Tuesday, September 18, 2012

BOVESPA: Pause to reflect after Friday's indecision?

Brazil's BOVESPA Close @ 09/17/2012
The long 'indecisive' candle from Friday has yet to witness follow through lower.....yet.
Chinese worries continue to mount & Brazil remains in the 'cross- hairs' of any fallout from the Asian 'miracle'.

Friday, September 14, 2012

BOVESPA: "Samba" time.......Weekly Close needed

Brazil's BOVESPA: Weekly as @ 09/13/2012

We still await the 'official' Weekly Close; so far the Daily has closed above the 'Blue Line' that has defined the bearish prognosis.
Now only Shanghai's $SSEC remains under 'siege' technically.....a fortune cookie with your QEIII?

Thursday, September 13, 2012

COPPER: "ain't saying, simply showing......"

COPPER Daily Chart 09/12/2012
German Court 'weighs in', the FOMC next in the congo line of 'bail- out' samba.......or not?
Is the party just beginning or just ending?

Tuesday, September 11, 2012

S&P500 'Reversal'.......good enough?

SPX Daily Close @ 09/10/2012
Too 'cute' for a top?
The Outside Down Day is a 'skinny' one @ best; but nothing appears without a sign....is this it?
Friday's comparably 'heavy' volume day to Thursday's large advance has now been potentially confirmed by Monday's price action.
Follow through lower Tuesday key to a higher degree of confidence that a retrace (1375/90) is upon us.

Friday, September 7, 2012

New Highs 'scored'...what happens next?

S&P500 Daily Close @ 09/06/2012
THE WEEKLY (08/31/12): "Expanding Volume Friday suggests that another minor high is possible, signs if/ when that happens to be awaited before setting any new ‘tactical’ positions.
Absent a Weekly Reversal; the bias remains that the market ‘wants’ to probe higher"......so far so good.
Friday's Non- Farm Payrolls either confirming the 'all systems go' for higher still or another 'oops' moment with the potential for this to be yet another 'minor new high' and back into range we go......again.

Wednesday, August 29, 2012

"If you’re rich you get a bailout. If you’re poor you get a handout. And if you’re middle class you get left out."

ASX200 Daily Close @ 08/28/2012

The looming battle of the 2 technical signals; either the 'inevitable' positive crossing 50/200day SMAs will attempt another 'buy signal' (the last one was a 'heroic' failure), or the MACD's 'Sell' cross is @ the very least foretelling a test of the 50/200 circa 4200/10 before the true intent of the nascent rally is fully known.

Friday, August 24, 2012

COPPER's turn to 'hesitate'?

COPPER Daily Chart Close @ 08/23/12
Copper now scores an 'indecisive' daily chart pattern; right where it is supposed to.
Following on from the NDX100; is time now 'out' for the pre- QEIII rally?
Super September looms large as the FED, Jackson Hole & the ECB are ALL supposed to 'ride to the rescue' and pull some more rabbits out the proverbial 'monetary' hat.
Where's Rocky & Bullwinkle when we need them?

Thursday, August 23, 2012

Singapore's STI 'the canary' as well?

Straits Times Index (STI)  Daily Close @ 08/23/212
Always a good 'signal' for where potentially Asian stocks are headed over the medium term, the $STI appears to be on the cusp of succumbing to the Negative Divergences in place since mid- July.
Let's see.............

NDX100 'marks' the High (end of rally)?.......

NDX100 Daily Close @ 08/23/2102
If we are to use the NDX100 as THE 'Risk- On' measure (& who doesn't?);
then the Outside Down Day registered Tuesday does give us the 1st Tactical Sign that this rally is probably 'done'.
If so then the simple 38% retrace, coincident with 2x's previous highs circa 2665 shall be our first 'port of call' on any retrace.
"Engine room............"

Monday, August 20, 2012

Interesting point for the BOVESPA.

BOVESPA Weekly Close @ 08/17/2012

The 'dotted blue line' remains valid (just) until we witness a series of Daily Closes above it or a Weekly Close above.
The Large Range Indecisive Weekly Candle from last week suggests a 'pause' @ the very least, the China $SSEC Index's anemic performance weighing on the Emerging Markets & Commodity types.
Iron- Ore & Coal Prices are the $'s to watch as they could 'pull the rug' from under the whole 'downstream' economic 'miners'.

Friday, August 17, 2012

BOVESPA puts on some 'samba'......

Brazil's BOVESPA Daily Close @ 08/16/2012

Close but no 'negation' yet of the Outside Down Day witnessed 2 days  ago.
Above the 200day SMA @ 59577 lies the 50% retrace & previous lows circa 61,000.
How 'high' is 'high' before some consolidation of the rally occurs?

Thursday, August 16, 2012

BOVESPA reversal @ the 200day SMA.

BOVESPA Daily 08/15/2012

Outside Down Day right @ the 200day SMA & below the 60K zone portends badly not only for Brazil but perhaps Emerging Markets in general as China's $SSEC retests its lows @ 2100.

Wednesday, August 15, 2012

Nasdaq & NYSE McClellan both below Zero....

Close 08/14/2012

The Summation Index remains below Zero & that together with the Oscillator falling into negative territory leaves equities vulnerable to selling pressure in the immediate term.

Let's see how it plays out...........

Thursday, August 9, 2012

BOVESPA finally 'tests' the 59K zone........

Brazil's BOVESPA: Close @ 08/08/2012
"BRAZIL’s BOVESPA ($BVSP) WEEKLY INDEX“... The Bad News: Rally back to 57/60K “FOR SALE”.” 06/01   “Whilst below 58000 the trend still remains lower.” 07/06   “Finally a sign of a low for the BOVESPA? The wide range weekly trade now highly suggestive of a.. serious test back to the rising Resistance Line @ 59K & rising. That is our bias.” 07/27   No Change; Higher S/T."

(Excerpt from THE WEEKLY issue August 3rd 2012.)

Wednesday, August 8, 2012

"Tall and tan and young and lovely..."

Brazil's BOVESPA Daily Close @ 08/07/2012

Not so 'tall & tan' as the BOVESPA (& Singapore's STI) do not join in the 'samba' rally, Germany's DAX temptingly close @ 6979.63 vs. the 'Gap' to fill @ 6981.21 & the NDX100 having done its 'fill' Monday.

"when she walks its like a samba.....ahhhh"

All eyes on what happens next.

The Girl From Ipanema................

Tuesday, August 7, 2012

NDX100 GAP @ 2697 'closed'...DAX still there @ 6981.21

NDX100 Daily Close @ 08/06/2012
DAX Daily Close @ 08/06/2012

Whilst the NDX100 has finally retraced & closed the 2697 GAP; the German DAX is now 'ever so close' to doing just that......after that becomes the interesting development.
Signs of a reversal (high) in both indices ( basis Daily & Weekly Charts) would go a long way in suggesting this particular Rally has ended.

Sunday, August 5, 2012

If there's one thing that should worry us......

Industrial Metals Index ($GYX) Close @ 08/03/2012

Equities may rally, treasuries may sell off & relief rallies in the Euro inspire all sorts of other currency buying.....but 1 thing that fails 'to lift' amid the drama in Europe is that which China imports to re-export: Industrial Metals. We've been warned.

Thursday, August 2, 2012

DAX does what it does best....'frustrates'.

DAX Daily Close @ 08/01/2012
Indecisive Daily Candle after breaching/ invalidating the Bearish Engulfing from July 20th is what the DAX does best....throw us off 'the scent'.
An outside down day in the new 'RISK Anything' AUD/USD portends that perhaps the Draghi "whatever it takes" statement needs "within the mandate of the ECB" qualification that was NOT widely reported...repeated out LOUD!?

Sunday, July 29, 2012

S&P500 @ new highs for this rally......however

DAX Daily Chart @ close July 27 2012

The NDX100, DAX & $SML are yet to scale the heights of their recent highs, unlike the ascendant S&P500.
Notably the DAX remains under the influence of that Outside Down Reversal day from the previous Friday that signaled the early weakness witnessed this last week.

Sunday, July 22, 2012

Lower Indeed for the averages...DAX gives a 'signal'.

German DAX Daily Chart as @ Close 07/20/12

The Red Circle captures the "Outside Down" Reversal Friday; together with the NDX100's 'non- confirmatory' McClellan stats Thursday...well maybe the 'Bears' can get some yardage out of this potential turnover?

S&P500 Support lingers down @ 1333/40 defining a pause as against a  meaningful reversal.

Friday, July 20, 2012

NDX100 @ +1.14%/ IXIC @ + 0.80%...& yet?

IXIC Daily Close @ 07/19/2012

Distorted day's performance; as the $SML & R2000 both posted declines amid the small gains for the Big-Caps Indices.
A NEGATIVE 'print' for the McClellan Oscillator for the NASDAQ (IXIC) belies the 0.80% gain and together with the -4.79 'print' for the NYSE McClellan suggests a 'Major Move' is afoot and that may just be 'lower'???